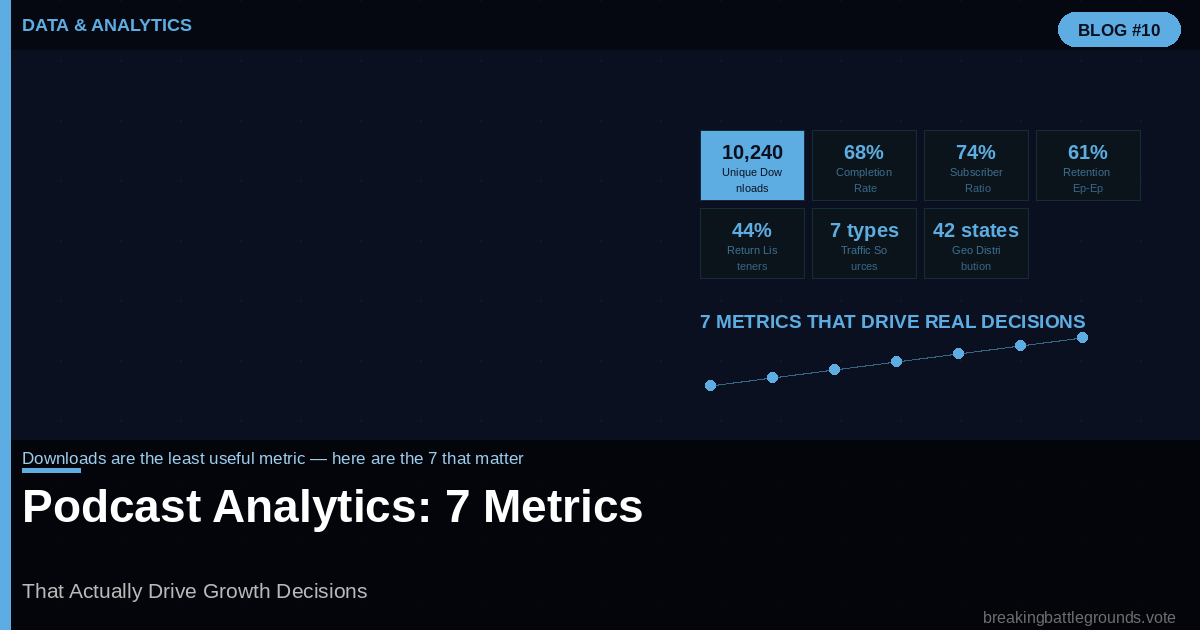
Downloads are the metric every podcaster obsesses over and the least useful number in your analytics dashboard. A show with 50,000 downloads per episode where 80 percent of listeners stop in the first ten minutes is a less valuable show, for listeners, for advertisers, and for the host’s long-term credibility, than a show with 5,000 downloads per episode where 75 percent of listeners finish every episode. The quality of audience engagement matters more than the quantity of downloads.
This guide covers the seven metrics that experienced podcasters use to make decisions, why each one matters, where to find it in your analytics platform, and what action it should trigger when the number tells you something.
Metric 1: Unique Downloads Per Episode (Not Total Downloads)
Most hosting platforms report both unique downloads and total downloads. Total downloads count every time an episode file is accessed, including re-listens, partial plays, and automatic downloads that listeners never actually play. Unique downloads count the number of distinct devices that downloaded the episode, a closer proxy for actual audience size.
The benchmarks that matter: according to Buzzsprout’s 2026 industry data, the top 10 percent of podcasts by unique downloads receive more than 3,600 downloads per episode. The top 25 percent receive more than 1,100. The median podcast receives fewer than 100 unique downloads per episode. Most advertiser minimums are 2,000 unique downloads per episode per 30 days.
The action trigger: if unique downloads are flat for more than eight consecutive episodes despite publishing consistently, the growth ceiling is a distribution problem (you need more listeners to discover the show) rather than a retention problem. If unique downloads grow but completion rates fall, you have a content quality or structure problem.
Metric 2: Episode Completion Rate
52% Industry average completion rate | 70%+ Top 10% shows average | 61% Drop-offs before minute 5 | 23% Retention boost from cold opens |
Episode completion rate is available in Apple Podcasts Connect (as average consumption) and Spotify for Podcasters (as listening rate). It shows what percentage of the episode’s audience listens to the end. This is the single most diagnostic metric for content quality and episode structure.
A completion rate below 40 percent on a 45-minute episode is a serious structural problem. A completion rate above 70 percent on the same length indicates that your episode structure and content quality are genuinely strong. Between 50 and 70 percent is the normal range for well-produced shows.
Metric 3: Subscriber-to-Download Ratio
This ratio measures how many of your total listeners have committed to following the show on a platform, they have actively chosen to receive future episodes automatically. A show with 10,000 downloads and 8,000 followers has a strong committed audience. A show with 10,000 downloads and 400 followers is dependent on passive discovery for almost every listen.
The action trigger: a low subscriber-to-download ratio indicates that your show is reaching people through discovery (search, recommendations, social sharing) who are not converting to consistent listeners. The fix is a stronger subscriber call-to-action within the episode, typically placed at the natural emotional peak of the conversation when listener investment is highest.
Metric 4: Episode-to-Episode Subscriber Retention
This metric asks: of the people who listened to Episode 100, what percentage also listened to Episode 101? High episode-to-episode retention indicates that listeners are following the show consistently, not just sampling individual episodes. Low retention indicates that discovery is bringing in listeners who do not become subscribers.
Finding this metric requires host platform analytics (Spotify for Podcasters shows audience overlap between episodes) or a listener survey. The best indication of retention is comparing unique downloads across your ten most recent episodes, a flat or slightly declining line indicates normal fluctuation; a steep decline indicates that recent episodes are not retaining the audience built by earlier ones.
Metric 5: Traffic Source Breakdown
Where are your listeners coming from? Apple Podcasts organic search, Spotify algorithm recommendations, your website, social media referrals, or external press coverage each require different strategic responses. Most podcast hosting platforms provide at least rough source attribution in their analytics dashboards.
The action trigger: if more than 70 percent of your traffic comes from a single source, you have concentration risk, a platform algorithm change can devastate your audience overnight. Diversification across Apple, Spotify, YouTube, and your own email newsletter reduces this risk. If organic search is your primary source, invest in SEO optimization of your show notes and episode titles.
Metric 6: Returning Listener Percentage
This metric distinguishes your loyal core audience from one-time listeners. Spotify for Podcasters provides a breakdown of new versus returning listeners per episode. Apple Podcasts Connect provides similar data through its Unique Devices metric compared across episodes.
A healthy returning listener percentage is 40 to 60 percent of each episode’s audience. Below 30 percent means most of your audience is new each episode, you have a retention problem. Above 70 percent means you are not growing, new listener acquisition needs investment.
Metric 7: Geographic Distribution
Where your listeners are located shapes sponsorship strategy, guest selection, and content focus. A show with 80 percent U.S. audience can target U.S.-specific advertisers at premium rates. A show with 40 percent international audience has different advertising value and potentially different content needs.
For political shows like Breaking Battlegrounds, geographic concentration in politically engaged states, Arizona, Georgia, Michigan, Pennsylvania, correlates directly with advertiser value for political campaigns and policy organizations. A show with concentrated listenership in swing states commands premium political cycle advertising rates beyond what general CPM benchmarks suggest.
Building Your Analytics Dashboard
No single platform provides all seven metrics in one place. The practical setup: use your hosting platform (Buzzsprout, Libsyn, Podbean, Captivate) for unique downloads, subscriber counts, and geographic data. Use Apple Podcasts Connect for completion rate (average consumption) and Apple-specific follower metrics. Use Spotify for Podcasters for listen rate, new versus returning listener data, and demographic information. Combine these three sources in a monthly analytics review.
A monthly analytics review, 30 minutes examining these seven metrics across the most recent four episodes, produces more actionable insight than daily download checking. Daily checking produces anxiety without decision-relevant data. Monthly reviewing produces patterns that inform structural decisions about content, format, and promotion.
Frequently Asked Questions
What is a good number of podcast downloads?
Context determines what is ‘good.’ The median podcast receives fewer than 100 unique downloads per episode. The top 10 percent receive more than 3,600. Most podcast advertisers require a minimum of 2,000 unique downloads per episode per 30 days. Growth rate matters as much as absolute numbers, a show growing 20 percent per quarter from a small base is more valuable than a flat show with larger numbers.
Where can I find my podcast analytics?
Podcast analytics are available from three sources: your hosting platform (Buzzsprout, Libsyn, Captivate, etc.) for download data and geographic distribution; Apple Podcasts Connect for completion rates and Apple-specific follower metrics; and Spotify for Podcasters for listen rate and audience demographics. Third-party tools like Chartable aggregate these sources.
What is episode completion rate and why does it matter?
Episode completion rate is the percentage of listeners who listen to the end of each episode. The industry average is 52 percent. It matters because it is the most direct measure of content quality and episode structure. Advertisers increasingly require completion rate data alongside download numbers because completion rate predicts ad exposure with more accuracy than total downloads.
How often should I check my podcast analytics?
Weekly download checking provides reassurance but rarely actionable insight. Monthly analytics reviews, examining all seven key metrics across the four most recent episodes, produce the pattern recognition needed to make structural decisions about content, format, and promotion strategy.